Dinky theme
Dinky is a red hot theme for GitHub Pages.
This project is maintained by afran190

analyzing_urban_mortality_data
Final project for Pratt Institute course INFO-664 that aims to analyze the causes of death across various U.S. cities by leveraging publicly available datasets accessed through open city data portals.
Introduction
Project Title: Visible Deaths, Invisible Data: Mapping Mortality and its Gaps Across Cities
Project Description: This project aims to analyze the causes of death across various U.S. cities by leveraging publicly available datasets accessed through open city data portals. Many municipalities now provide access to their data via APIs, often powered by platforms like Socrata, enabling efficient, programmatic retrieval of mortality-related statistics.
The research focuses on creating a comparative narrative instead of building a unified dataset by studying which causes of death different jurisdictions track and which remain unrecorded, or hidden, or inaccessible. Through utilizing open data APIs and data visualization tools, it will examine mortality patterns including overdose-related deaths, deaths in custody, and/or COVID-19 related deaths while exposing structural gaps in official records. Findings will focus equally on the missing data points as much as it does on the recorded information.
Project Rationale: Public knowledge and civic accountability depend heavily on government-mandated open data portals, which NYC Open Data represents, as a fundamental resource. These systems demonstrate the policy-based priorities and exclusionary practices that exist within them. The New York City requirement of Local Law 11 demands public dataset publication, but Rikers Island along with other institutions remain in a state of inconsistent data disclosure. The process of making deaths visible in public discourse raises essential questions about transparency and oversight, and which deaths become visible to the public. The aim of this research is to investigate these tensions through the available data in municipalities across the country to analyze structural omissions and recordkeeping political dynamics in U.S cities.
Key Research Questions:
- What causes of death are publicly recorded in major city open data portals, and which categories (e.g., in-custody deaths, overdose deaths) are consistently missing or incomplete?
- How does the availability and granularity of mortality data vary across cities, and what policies or legal mandates shape this availability?
- In what ways do patterns of data omission correlate with social marginalization, such as incarceration, homelessness, or poverty?
Methods and Workflows:
To carry out this analysis, the project used the following tools, technologies, and methodologis:
Sources:
- APIs provided by city open data portals (e.g., NYC, Chicago, San Francisco, and Austin) have been accessed using
soda.py, a Python library for the Socrata Open Data API. This allowed for structured and automated data retrieval.- These cities were selected to represent different geographic regions of the United States and because they are generally regarded as progressive municipalities with strong commitments to transparency and civic data infrastructure. The assumption was that these cities would be more likely to publish comprehensive and well-maintained datasets.
- While searching through each open data portal, a wide range of keyword variations had to be used across the three subject categories (incarceration-related deaths, COVID-19 deaths, and drug-related deaths), in order to surface any relevant records, where available.
Data Collection:
-
I utilized the NYC_data.ipynb Jupyter Notebook I created as the template for related investigations into other U.S. cities. NYC was selected as the foundational case study because it is the only city that offered (at least partial) data across all three of the research categories.
- Setting up Socrata:
- To access datasets through city portals using the Socrata platform, I first created a user account, which enables access across any open data site powered by Socrata.
- To avoid API rate limits, I also requested and configured an “App Token” for authenticated access—an example of which is provided later in this notebook.
- Finally, I installed the required Python library, sodapy, directly into my Jupyter notebook using the following command:
!pip install sodapy
- Calling in APIs:
- Began with authenticatication via the Socrata Open Data API for each data set I called in. In total nine data sets across the 4 cities were retrieved, although some returned data that did not align with my research scope:
from sodapy import Socrata
client = Socrata(
  "data.cityofnewyork.us",  # varies based on URL of each city
  "YOUR_APP_TOKEN",         # Replaced with my personal app token
  username="your_email@example.com",
  password="your_password"
)
- Began with authenticatication via the Socrata Open Data API for each data set I called in. In total nine data sets across the 4 cities were retrieved, although some returned data that did not align with my research scope:
- Setting up Socrata:
-
Then I pulled each individual date set through the below identifiers:
results = client.get("f64t-5yiv", limit=1000)  # changed each Data Set Identifier and limit based on each data set
results_df = pd.DataFrame.from_records(results)
Data Cleaning:
-
To ensure consistency and prepare the datasets for analysis and visualization, OpenRefine was used as a key tool for cleaning and transforming the raw data retrieved from each city’s open data portal. While the exact steps varied slightly depending on the dataset, the core cleaning tasks included:
- Removing unnecessary columns that did not pertain to the research focus (e.g., dropping metadata or unrelated stats).
- Cleaning timestamp values from date fields (e.g.,
date_of_interest) by splitting strings on the"T"delimiter and removing time portions. - Standardizing numeric formats, such as stripping trailing decimal zeros from cumulative case and death counts, to ensure accurate rendering in charts.
- Renaming columns for readability and to streamline future coding operations.
- Filtering by geographic granularity, retaining only neighborhood- or borough-level information relevant to the mortality data.
Examples by City:
- NYC: Removed non-essential columns, split and cleaned the
date_of_interestfield, and retained only borough-specific death and case data. - Chicago: Dropped irrelevant columns and formatted numeric values (e.g., removing unnecessary decimals from
cases_cumulative). - San Francisco: Cleaned by neighborhood-level detail, renamed columns, and applied similar numeric transformations.
- Austin: No OpenRefine steps were explicitly recorded.
OpenRefine was especially useful for making datasets analysis-ready without writing extensive code-based transformations, allowing for a more flexible and visual approach to cleaning civic data.
Data Analysis and Visualization:
-
Cleaned datasets were analyzed using Python libraries such as
pandasfor data manipulation andplot.lyfor interactive visualizations. This will enable the exploration of trends and correlations across different variables and cities.Examples by City:
- NYC:
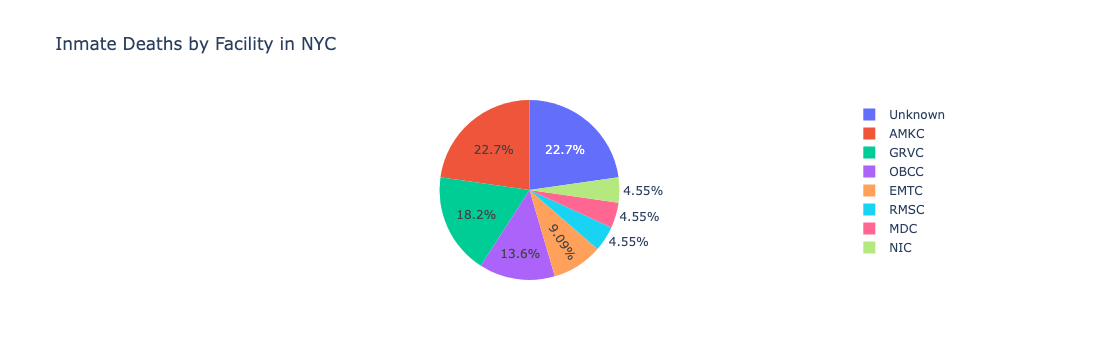
- A pie chart was created to show inmate deaths by correctional facility:
```python import plotly.express as px
facility_counts = df_inmate['facility'].value_counts().reset_index() facility_counts.columns = ['facility', 'death_count'] # Create pie chart fig = px.pie( facility_counts, names='facility', values='death_count', title='Inmate Deaths by Facility in NYC', color='facility' # Automatically sets distinct colors ) fig.show() ``` - Austin:
- A bar chart illustrated the number of drug overdose deaths by year:
   fig = px.bar(results_df_drug, x='year', y='count_of_deaths',
             title='Austin Drug Overdose Deaths by Year')
   fig.show()
- A bar chart illustrated the number of drug overdose deaths by year:
- San Francisco:
- A line chart compared overdose death rates by race/ethnicity over a three-year period:
   fig = px.line(df_drug, x='year', y='overdose_death_rate', color='race_ethnicity',
             title='SF Overdose Death Rate Over Time by Race/Ethnicity', markers=True)
   fig.show()
- A line chart compared overdose death rates by race/ethnicity over a three-year period:
These visualizations were essential in identifying patterns across time and demographic groups, as well as exposing disparities and data gaps across regions.
- NYC:
Documentation of Absences:
-
The documentation of absences became a critical part of the project narrative, highlighting which populations, causes, and events were systematically underreported, or entirely unrecorded, despite the presence of open data infrastructures. To complement the structured analysis of available datasets, I also created a tracker (
city_available_data_sets_tracker.csv) to document where data was missing, incomplete, or obscured across city open data portals.This spreadsheet records which cities provided datasets in the following categories:
- Inmate Deaths
- COVID-19 Deaths
- Drug-Related Deaths
For each city and dataset type, the tracker includes:
- A yes/no indicator for both data availability and demographic breakdowns
- A Special Notes column that describes anomalies, outdated datasets, or known gaps in coverage
The notebook
city_data_tracker.ipynbwas used to:- Read in the CSV tracker as a DataFrame
- Visually summarize absence patterns for reporting
Findings and Analysis:
- Based on the compiled tracker, the analysis of publicly available mortality datasets across U.S. cities reveals notable inconsistencies in both data availability and transparency; particularly around deaths of people who are incarcerated, COVID-19 fatalities, and drug-related deaths. The “Special Notes” column in the spreadsheet surfaces key anomalies, gaps, and archival issues that significantly impact the comprehensiveness and usability of each dataset.
City-Level Findings:
New York City:
New York City offers relatively broad access to all three data types. However, closer inspection reveals significant limitations:
- COVID-19 data includes poverty demographics from antibody studies, but lacks race/ethnicity details.
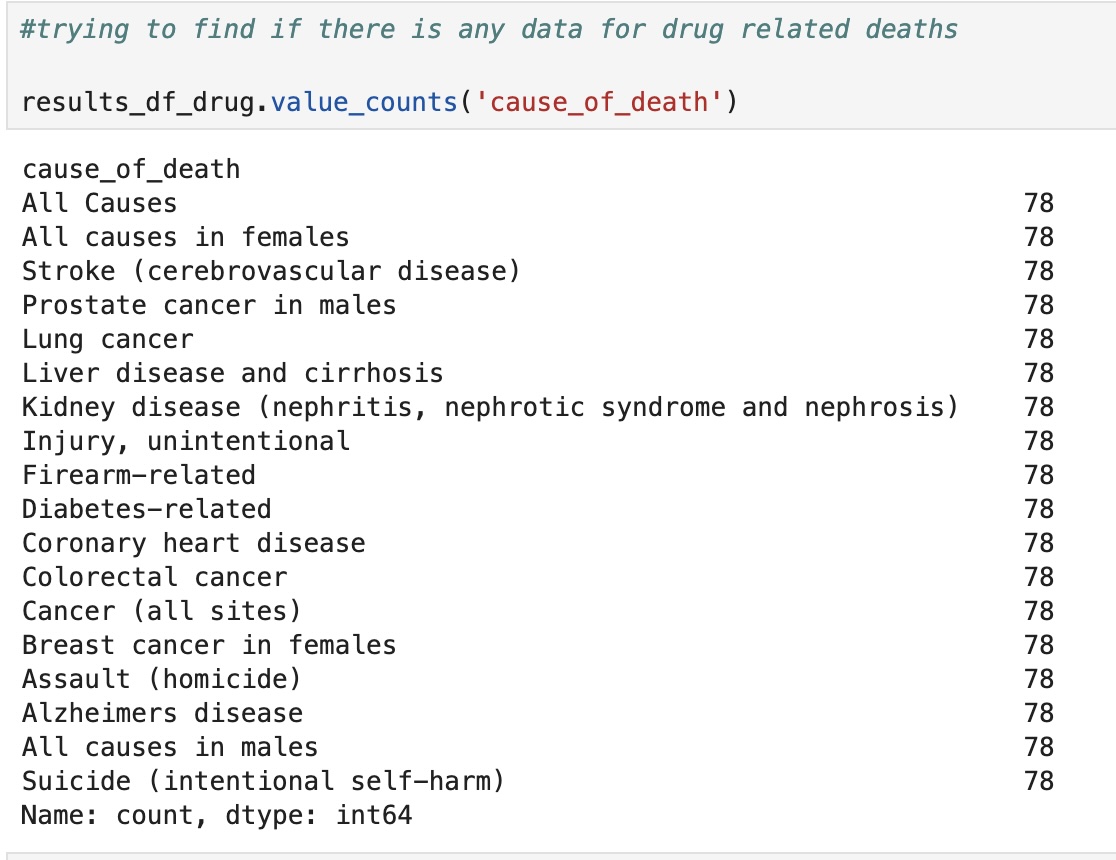
- Drug-related death data is more complete, including sex and ethnicity, but exists as a subset within larger cause-of-death datasets, not as a standalone resource.
- Inmate death data only accounts for 22 “non-natural” deaths between 2016 and 2021, implying potential underreporting or selective categorization, as seen in the below pie chart:
Despite NYC’s Local Law 11 mandating open data publication, these limitations highlight structural blind spots—especially for populations affected by incarceration or addiction.
Chicago
- No public data on inmate deaths; only general crime reports are available.
- COVID-19 death records that reflect demographics are archived across multiple fragmented datasets.
- Only has an archived “Selected underlying causes of death in Chicago, 2006–2010” data set; no drug realted deaths found as shown below:
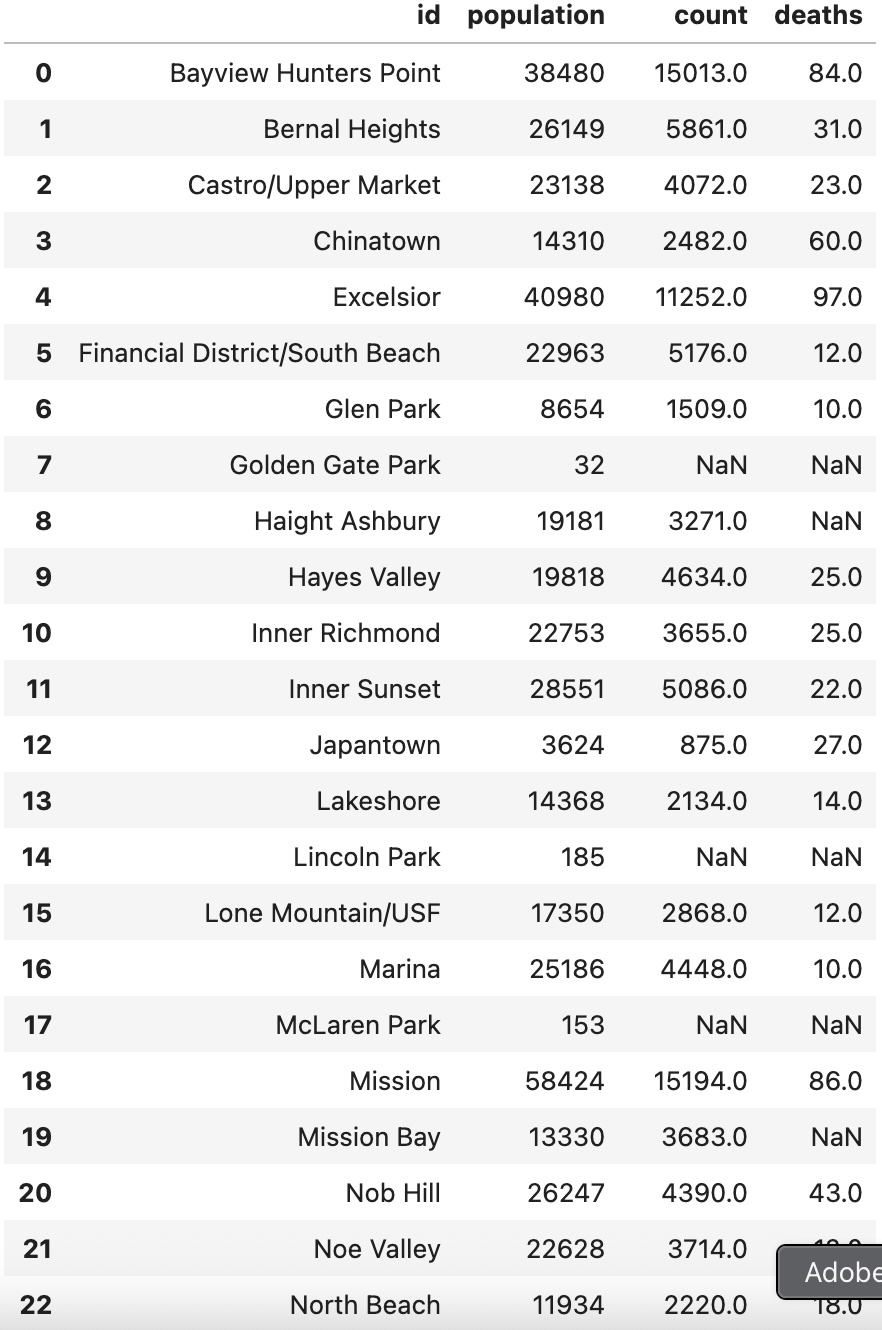
San Francisco:
- Only jail booking data is available indicating some effort at recordkeeping, but without transparency around outcomes like deaths.
- COVID-19 demographic data by zip code is archived (May 2020–Sept 2023), allowing for some further socio-economic analysis. This data set only covers deaths that had associated zip codes, so totals did not account for all deaths within a zip code:
Austin:
- Incident reports are available for individuals in juvenile detention, but no deaths were reported in the dataset.
- For COVID-19, Austin uses its own data visualization platform; however, raw datasets are not downloadable; web scraping may be necessary, though the site is dynamic.
- Drug-related death data is available only through 2021 and lacks demographic details:

Key Takeaways:
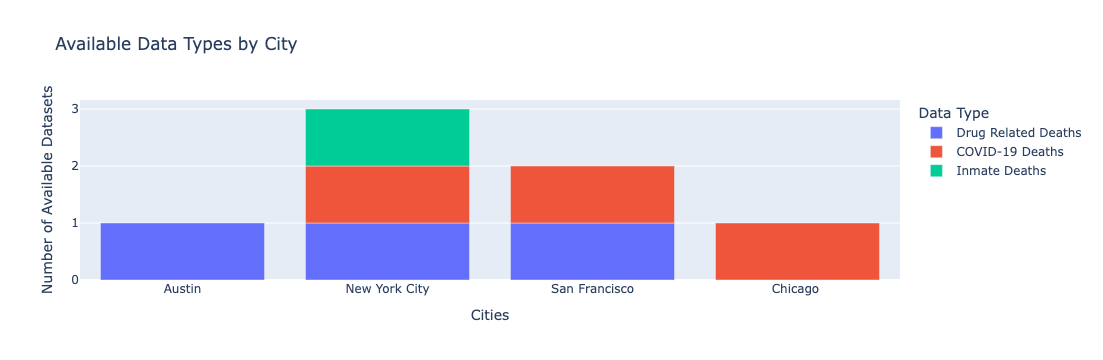
- Incarceration-related deaths are under-documented. No city provides detailed, disaggregated public datasets of in-custody fatalities.
- COVID-19 death data is fragmented. Many cities publish multiple partial or outdated files with minimal standardization.
- Drug death reporting varies widely. Some cities provide sex/ethnicity data; others publish only raw totals.
- Open data laws (e.g., NYC’s Local Law 11) don’t appear to fully apply to carceral systems like Rikers Island, exposing limitations in transparency mandates.
Future Uses and Continuation of Research:
This project offers a foundation for multiple options of future research or expansion:
-
Comparative Policy Analysis: While this project only scratches the surface, it opens the door to more systematic research into how data transparency laws vary by city and how these differences affect public access to mortality records. Through techniques like web scraping, future researchers could identify policy language and legal frameworks that mandate, or omit, the reporting of deaths, especially in carceral contexts. For example, NYC Open Data frames its mission as more than a one-time effort, stating:
“We at the Open Data Team don’t just want to 'open' data, we want to keep opening it with continuous, incremental improvements to the level of transparency, access, and accountability of NYC Open Data.” -
Watchdog Tools: Journalists or advocacy organizations could use the codebase to monitor cities’ compliance with open data laws or track patterns of omission.
-
Public Interfaces: With further development, the visualizations and findings from this project could be adapted into a public-facing website or dashboard, tracking the absence of or lack of updates in municipal death records.
Project Files:
- New York City Data Sets
- NYC_Data.ipynb: Python Notebook containing NYC Open Data APIs calling data sets of Inmate, COVID-19, Drug-related deaths; accompained by different plot.ly data visualizations unique to each data set
- NYC_inmate_data_unclean.csv and NYC_covid_data_unclean.csv: saved csv’s with uncleaned data pulled from NYC Open Data
- NYC_inmate_data_uncleaned.csv, NYC_covid_data_clean.csv, NYC_drug_data.csv: cleaned data post-OpenRefine transformations
- San Francisco Data Sets
- SF_Data.ipynb: Python Notebook containing SF Open Data APIs calling data sets of COVID-19 and Drug-related deaths; accompained by different plot.ly data visualizations unique to each data set, if applicable.
- SF_drug_data_unclean.csv and SF_covid_data_unclean.csv: saved csv’s with uncleaned data pulled from SF Open Data
- SF_drug_data_uncleaned.csv and SF_cvoid_data_clean.csv: cleaned data post-OpenRefine transformations
- Austin Data Sets
- Austin_Data.ipynb: Python Notebook containing Austin Open Data APIs calling data sets of Inmate and Drug-related deaths; accompained by different plot.ly data visualizations unique to each data set, if applicable.
- **Asutin_drug_data.csv: saved csv’s with data pulled from Austin Open Data; no OpenRefine cleaning needed
- Chicago Data Sets
- Chicago_Data.ipynb: Python Notebook containing Chicago Open Data APIs calling data sets of COVID-19 and Drug-related deaths; accompained by different plot.ly data visualizations unique to each data set, if applicable.
- Chicago_covid_data_unclean.csv and Chicago_drug_data_none.csv: saved csv’s with uncleaned data pulled from Chicago Open Data
- Chicago_covid_data_clean.csv: cleaned data post-OpenRefine transformations
- Chicago_covid_data_sums.csv: trasnformed data from Chicago_covid_data_clean.csv dataset
- Chicago_covid_data_sums_clean: cleaned data post-OpenRefine transformations
- City Data Availability Tracker
- city_available_data_sets_tracker.csv: A tracker I built to record which data and demographic details on inmate, COVID-19, and drug-related deaths are available, or missing, for each city. It includes special research notes highlighting anomalies and outdated datasets.
- city_data_tracker: Python Notebook containing plot.ly visualization based on data pulled from city_available_data_sets_tracker.csv
- Image of some data visualizations from plot.ly
- austin_drug_plot.png
- available_data_types_by_city_plot.png
- chicago_drug_none_plot.jpg
- nyc_inmate_plot.png
- sf_covid_plot.jpg